![]()
 Your first order of business in looking at current investing trends is to see if the hot trend is worthy and justifiable, or whether it is just a mania leading to a bubble. While it can be profitable to ride the bubble as it is getting started, it is extremely important to make the leap out before the bubble bursts. Doing that, of course, is easier said than done.
By now, you should already know that when you use Stop Loss orders, you will NOT be as susceptible to bubbles as compared to those investors who are NOT using Stop Loss orders.
In his book “Manias, Panics, and Crashes: A History of Financial Crises”, Charles Kindleberger notes that bubbles always implode and are easily recognizable because the bubble represents a “non-sustainable pattern in price changes or cash flow.” In other words, prices for hot investments like real estate, stocks or oil simply go up too much and too quickly.
History is full of price manias and bubbles. Just in the last decade we have seen:
- In March 2000, the Nasdaq composite index hit 5,048.62 and then the bubble popped and the index fell to 1,114.11 in the 2002 bear market.
- In April of 2006, housing prices in the U.S. peaked, and then home prices fell 31.9% to a low in May 2009, according to the S&P/Case-Shiller 20-city index.
- In March of 2008, gold traded at over $1,000 an ounce for the first time ever, but by the end of the year it had given up 25% of its value.
- In July 2008, crude oil prices rose over 70% in just six months to a high of $147.27 and then the bubble popped and oil fell to $33.87 in just five months.
- In the summer of 2008, prices for soybeans and corn hit record levels. In the first six months of the year, corn shot up more than 60 percent and soybeans rose more than 30 percent. By December of 2008, both grains had lost half their value.
There have even been investment manias in Tulips, believe it or not! In the 1630s in Amsterdam, investors bought tulip bulbs vigorously and soon a bubble formed where just one tulip bulb was valued at the price of one year’s labor for an average worker in Holland! Needless to say, this price was not sustainable and the value of tulips did not stay this high for long.
Charts are a great way for spotting investment bubbles. Sharp, quick spikes upwards in prices are the classic telltale sign of an over-bought and bubble-like market. Take a look at the charts of some of the most recent bubbles. Notice how each had a massive rise in prices and then a painful popping, or crash, of the bubble:
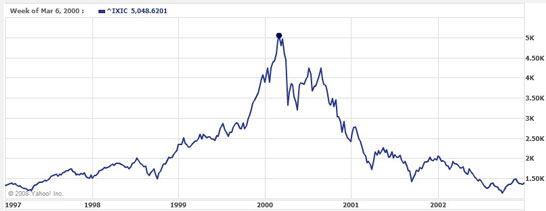
The NASDAQ stock index or “dot.com” bubble in early 2000 hit 5,000.
Ten years later in 2010, this index traded around 2,000, 60% below the bubble’s peak.
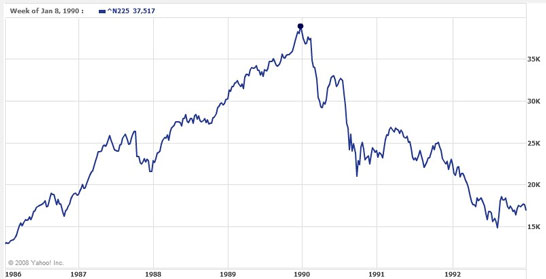
The Tokyo Stock Market Bubble peaked late in 1989 at 37,500.
21 years later in 2010, this index was still only trading at 10,000, 73% below the 1990 peak.
 Another way to know if there is an investing mania is to be aware of what is popular, and what is really just way too popular. Remember, prices are nothing more than a reflection of supply and demand, and if everyone wants something, then its price will skyrocket! But as soon as buyers move on to something else, those prices must plummet! Are the news magazines all writing about an investment? Are they on the covers with splashy headlines and creating a feeding frenzy among the masses? If so, then beware…
Time magazine’s cover in late 1999 made it seem like everyone was getting rich from Internet stocks

Along these same lines, another warning sign is when your friends are recommending investments without any sound rationale. If you are at a party or any other social gathering and your friends/colleagues start recommending their “hot stocks”, then ask your friends why the stock is “hot.” If they can’t talk about a company’s sales, costs, profits, or strategy for at least 60 seconds, then stay away from that stock!
Time magazine’s cover in Summer 2006, at the height of the U.S. residential real estate bubble
In December 1999, at a holiday party for my work, I sat next to the husband of a colleague. As was typical of the day, the conversation quickly turned to investing in technology stocks. He said that Qualcomm (QCOM) was a great stock to buy NOW, despite the fact that it had already gained over 1,500% that year! He had no personal knowledge of Qualcomm’s business; its proprietary technology, the potential of the wireless phone market or any other fundamental reason to own the stock. All I could think of at this point was the scene in the movie “CaddyShack” when Rodney Dangerfield is playing golf and he gets a call from his stockbroker and he says, “I told you never to call me on the golf course! What’s that? Everyone is buying? Then sell. Sell. Sell!” I quickly sold my shares in QCOM for a sweet profit.
QCOM’s amazing rise in 1999 followed by a money-losing performance in 2000-2002
Unfortunately, manias or “bubbles” are very common in the history of the markets and one must always be vigilant in looking for the next one that might take your hard-earned investment money. While hot stocks and hot asset classes are the most common forms of investing manias and bubbles, investing strategies and trading techniques are also subject to popularity and fads. The following are currently the most popular methods for finding and investing in stocks…
 Teacher Introduction Webinars
 1-14 Chapter 1 Exam
 Futures Trading FAQ