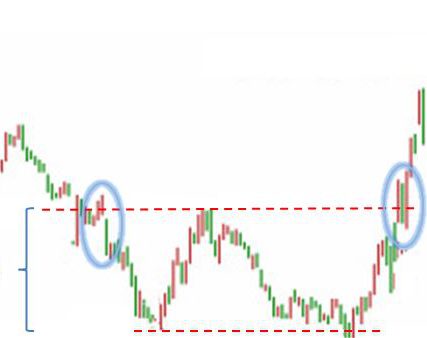
Double Bottoms are reversal patterns and often seem to be one of the most common (together with double top patterns) patterns for currency trading. Double Bottoms patterns are identified by two consecutive low prices of the same depth with a moderate pull back up in between (neckline peak).
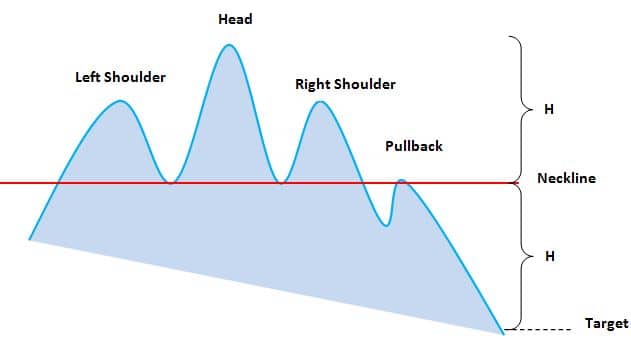
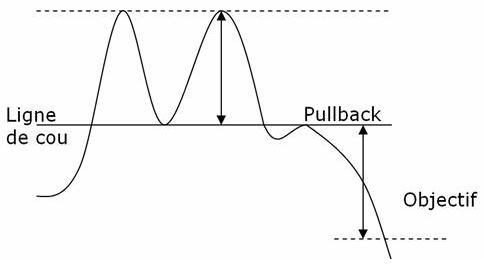
The head-and-shoulders pattern is one of the most popular chart patterns in technical analysis and indicates that a reversal is likely to happen after the pattern has been completed.

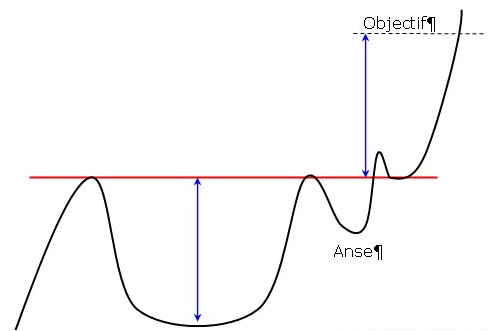
A cup-and-handle chart pattern resembles a cup of coffee. These are bullish continuation patterns where the growth has paused momentarily, it trades down and then continues its upward pattern. This pattern must always be at least 5 weeks long and can last up to a year. Click on this post to learn more.

The Collar Option Strategy is designed to limit the downside risk of a held underlying security. It can be performed by holding a long position in a security, while simultaneously going long a Put and shorting a Call. Read this article to read details of the strategy and to see a profit/loss example.
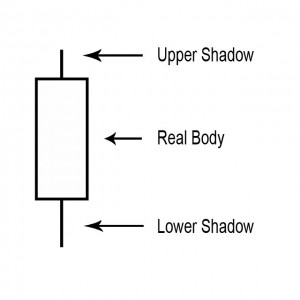
The body of the candlestick chart is the most basic building block for a candlestick chart. Read this article to learn more!
A point on a candle stick chart representing a specific time period (a day, an hour, a minute, etc) in which the underlying stock price has moved. Candlesticks will have a body and usually two wicks – one on each end.
The Resistance Line is a point or range in a chart that caps an increase in the price of a stock or index over a period of time.

Falling Knife is a phrase used for a stock where the price has dropped significantly in a short period of time. A falling knife security can rebound, or it can lose all of its value where the shares become worthless. Trying to catch a “falling knife” right as it rebounds is dangerous!

An inverted dead cat bounce will occur when a company discloses news that will send the stock soaring by 5% to 20% or perhaps even higher.

A trading term called a dead cat bounce is used to when a stock is in a severe decline and has a sharp bounce off the lows. It occurs due to the huge amount of short interest in the market. This bounce will be short lived and followed up by heavy selling which will break the prior price low.
A gap in a chart is basically an empty space between one trading period and the one prior to that trading period. They normally form on account of an important and material event that will affect security, like an earnings surprise or a merger agreement. Read this article to learn more!
Flags and Pennants are categorized as a continuous pattern. They normally represent only brief pauses in a dynamic stock. They’re typically seen immediately after a quick move. The stock will then take off again in the same direction. Click on this post for more information about Flags and Pennants.
The V top is a reverse V-shaped top, where the top is quite sharp. It’s due to the irrationality of actors leading to a steep increase that will be corrected shortly afterwards. Read this article to learn more!
The V Bottom is a sharp dip pattern due to irrationality of actors, which is corrected shortly after. Click on this article to learn more about what constitutes a V Bottom pattern.
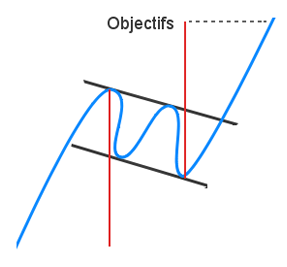
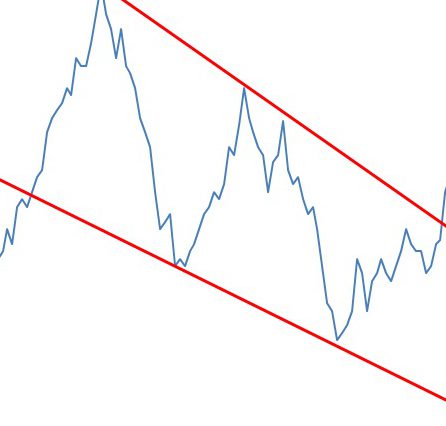
A horizontal channel is a pattern that underlines investor’s indecisiveness. This horizontal channel is assembled by two horizontal and parallel lines that build the progress of the price. To confirm a line, there should be at least two points of contact with the price. The more contact points it will has, the more these will be durable and their breakout will give an substantial buy/sell signal.
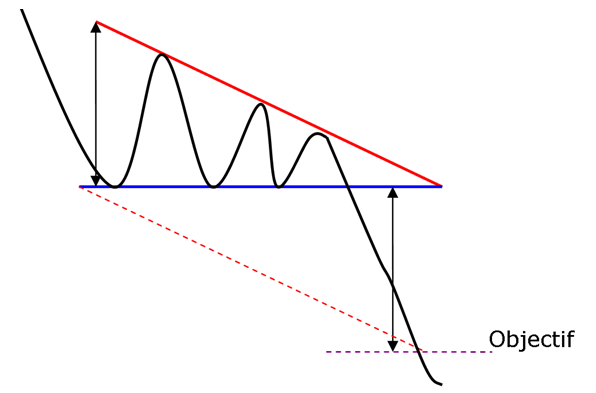
The descending triangle is a bearish continuation pattern. This pattern forms two converging lines. The initial is a downward slant which resistance and the other is a horizontal support. To validate the descending triangle, there must be oscillation between the two lines. The lines must be touched at least twice for validation.
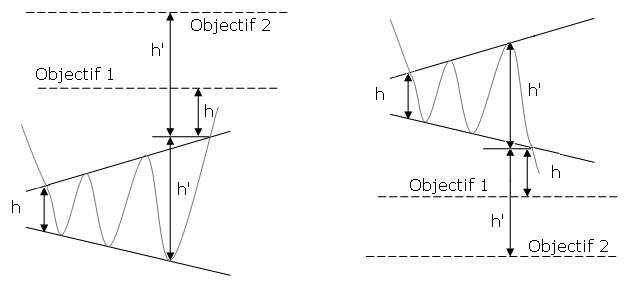
The symmetrical triangle top is a bullish continuation pattern. This pattern forms two trend lines which are symmetrical to the horizontal and convergent. Click on this post to learn more!
A symmetrical triangle bottom is a bearish continuation pattern. This pattern forms two trend lines that are symmetrical to the horizontal and convergent. Click on this post for more details.
The Cup and Saucer is a chart with a continuous pattern, formed by two rounded bottoms, the first is deeper and wider than the second. The height of the cup and the handle will be aligned along a straight horizontal resistance. This is the neckline of the pattern. Read this article to find out more!

A Rounding Top pattern is a reverse U-shape, also called a “reverse saucer. ” The top is rounded with a flat top. Read this post for further details and a visual representation of the pattern!
A Rounding Bottom, also known as a saucer, is a U-shaped bottom reversal pattern. The dip is rounded with a flat bottom. Click on this post for more information and a visual representation!
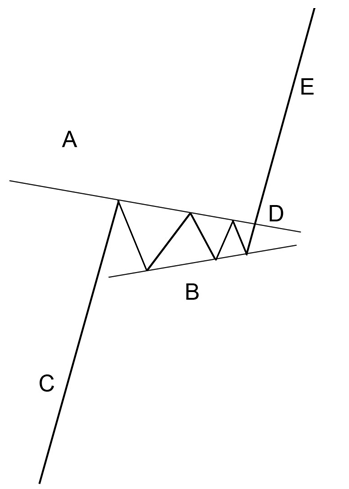
The pennant resembles the symmetrical triangle, but it’s characteristics are not the same. The pennants is shaped like a wedge of consolidation and normally appears after a sudden upward or downward movement.
The descending flag shows as a continuation pattern. The flag is built by two straight downward parallel lines which is shaped like a rectangle. It is oriented in the direction of that trend which it consolidates. Contrary to a bearish channel, this pattern is quite short term and shows the fact that buyers will need a break. Click on this post to learn more!
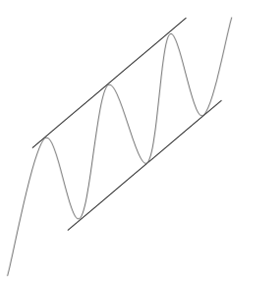
A bullish channel is called a continuation trend pattern. The bullish channel is assembled by two parallel lines that frame the upward price trend. Click on this article to learn more!
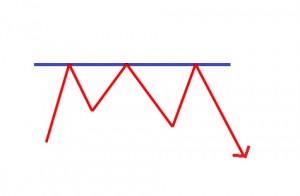
Click on this post to read about the Triple Top, which is a bearish pattern with an MN shape.
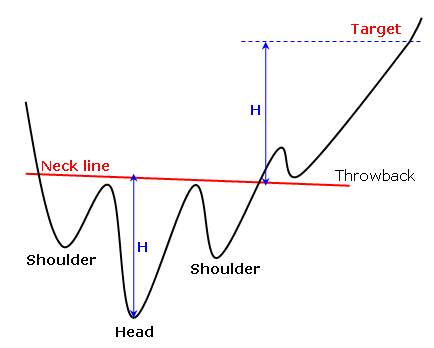
Reverse head and shoulders is a trend reversal pattern that marks a desire to make a bullish reversal. The theory is the same as a triple bottom other than the second bottom will be lower than the others, which are technically at the same height. Click on this post for more information.
The double top is a bearish pattern shaped like an M. Two tops must succeed, imaging an important resistance. This marks a reversal. Read this article for more information.
A reversal pattern is called a diamond bottoms. This pattern is formulated by two juxtaposed symmetrical triangles and it is shaped like a diamond.
A falling wedge is a bullish reversal pattern made by two converging downward slants. To prove a falling wedge, there has to be oscillation between the two lines. Each of the lines must be touched at least twice for validation.
A Rising Wedge is a bearish reversal pattern formed by two assembled upward slants. Read this post to learn more.
The Adam & Eve top is a type of double top that consists of a spiking first top, followed by a rounded second one. Read this article to learn more!

The formation, ascending broadening wedge is called this because of its similarity to a rising wedge formation and then has a broadening price pattern. The ascending broadening wedge differs from a rising wedge as the axis rises. Read this article to learn more!
The right-angled and ascending broadening chart pattern is not one you might choose to trade. Other chart patterns perform much better. Downward breakouts have a big break even failure rate which may disqualify them from your trading tools. Upward breakouts have only a middling average rise, and that is if you trade them perfectly.
The broadening bottom is one of those chart patterns that appears often, but you might want to avoid trading. The performance rank approaches the bottom of the list with a comparatively high break even failure rank and low average rise in a bull market. Its only redeeming value is the partial decline which does an excellent job of predicting an upward breakout.