Chapter 7
Chapter 7: Technical Analysis – Common Charts and Terms
Not long ago, Technical Analysis was considered the opposite of Fundamental Analysis. Rather than looking at a company’s products, its competitors and how much profit it makes, Technical Analysis looks at 2 things only: the prices for which a stock has traded, and the volume of shares traded at those prices. From these 2 data points, technical analysts locate patterns in stock price behavior, and surprisingly, more and more investors are seeing Technical Analysis as a complement to, not the opposite of, Fundamental Analysis.
So, the key to Technical Analysis is the history of prices paid for a stock and the volume of shares traded. We could create a history of the price paid for a stock by looking in the Wall Street Journal everyday and noting the closing price from yesterday. We could write down this price and then create a table to see the history of prices paid, like this:
Stock Prices of Google (GOOG)
| Date | Open | High | Low | Close | Volume | Adj Close* |
|---|---|---|---|---|---|---|
| 18-Dec-09 | 596.03 | 598.93 | 595.00 | 596.42 | 3,531,500 | 596.42 |
| 17-Dec-09 | 596.44 | 597.64 | 593.76 | 593.94 | 2,638,800 | 593.94 |
| 16-Dec-09 | 598.60 | 600.37 | 596.64 | 597.76 | 2,809,400 | 597.76 |
| 15-Dec-09 | 593.30 | 596.38 | 590.99 | 593.14 | 2,263,700 | 593.14 |
| 14-Dec-09 | 595.35 | 597.31 | 592.61 | 595.73 | 1,913,400 | 595.73 |
| 11-Dec-09 | 594.68 | 594.75 | 587.73 | 590.51 | 1,720,000 | 590.51 |
| 10-Dec-09 | 590.44 | 594.71 | 590.41 | 591.50 | 1,668,300 | 591.50 |
| 9-Dec-09 | 587.50 | 589.33 | 583.58 | 589.02 | 1,781,000 | 589.02 |
| 8-Dec-09 | 583.50 | 590.66 | 582.00 | 587.05 | 1,524,000 | 587.05 |
| 7-Dec-09 | 584.21 | 588.69 | 581.00 | 586.25 | 1,636,200 | 586.25 |
| 4-Dec-09 | 593.02 | 594.83 | 579.18 | 585.01 | 2,513,600 | 585.01 |
| 3-Dec-09 | 589.04 | 591.45 | 585.00 | 585.74 | 1,428,700 | 585.74 |
| 2-Dec-09 | 591.00 | 593.01 | 586.22 | 587.51 | 1,663,200 | 587.51 |
| 1-Dec-09 | 588.13 | 591.22 | 583.00 | 589.87 | 2,320,300 | 589.87 |
However, this method of tracking prices does not easily reveal trends and patterns. Thanks to modern computer technology, Technical Analysis has become an acceptable research tool and not just a strange science. If we chart this data from our table below, where price is vertical and time horizontal, we will literally create a picture of those numbers:
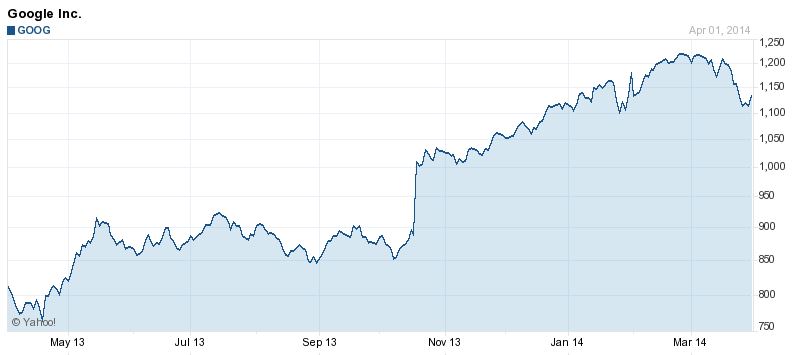
From this chart, we can easily see that Google has risen steadily over this time period. Now, which would you rather look at: the table or this chart? Of course, the chart!!!