
Businesses keep financial records so they will know how their company is performing financially. For publicly traded companies (ones you can purchase stock in), these records are also shared with investors. The three main financial statements companies use are the Income Statement, the Balance Sheet, and the Cash Flow Statement.
The income statement primarily focuses on the company’s revenue and expenses (what they’ve earned and what they’ve paid for) during a particular period of time. The bottom line shows a net profit or a net loss depending on the company’s performance during that time period. Companies may complete an income statement whenever they want, but typically they are completed quarterly (every three months) or annually.
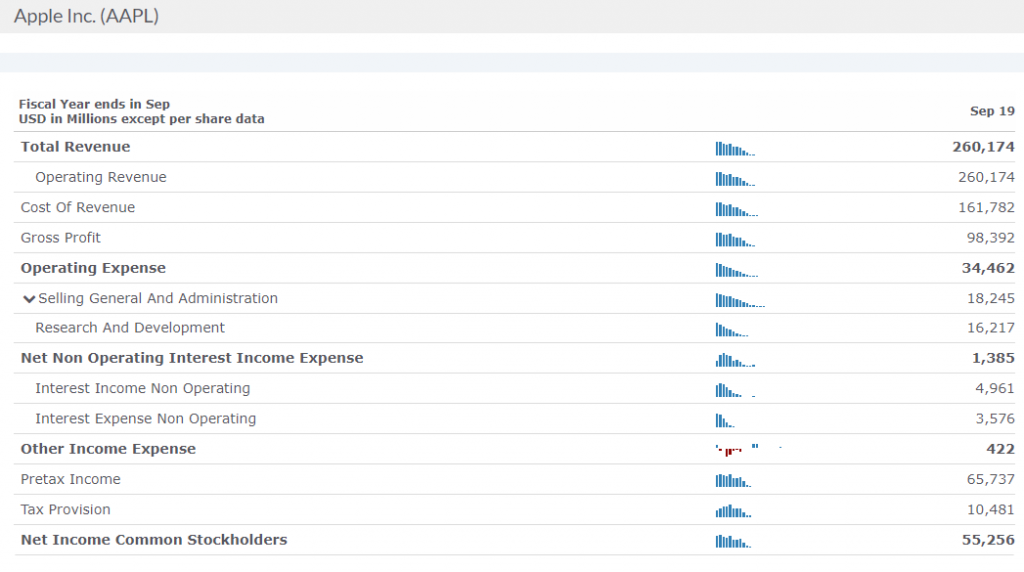
Explanation of an Income Statement
Income statements are known by various names including a Profit and Loss Statement and an Earnings Statement. This is because the income statement shows whether or not the company is making a profit. The income statement serves two main purposes: 1) It shows managers how the business is performing and whether or not sales are keeping up with expenses, and 2) It provides investors with a snapshot of the overall performance of the company. The important thing to remember about an income statement is that it represents profit for a particular period of time (e.g. 1st Quarter 2020). This contrasts with the balance sheet, which represents a single moment in time (e.g. September 2019).
The portion of the income statement that deals with operating items is interesting to investors and analysts alike because this section discloses information about expenses that are a direct result of the regular business operations. In the example provided, you see that this includes advertising expenses, sales commissions, and office supplies and equipment needed for the business to operate.
The portion that deals with non-operating items discloses revenue and expense information about activities that are not tied directly to a company’s regular operations. In the example provided, you see that this includes interest revenue, interest expenses, and loss from a lawsuit.
Steps in Understanding the Income Statement
In order to best understand how to read and understand an Income Statement Sheet, it’s important to understand the order of which information is displayed.
- Date: The date that the statement was created is always at the top. It reflects all data for a particular period of time such as “For the period of January to March 20xx.”
- Net Sales or Operating Revenue: This represents the total amount of revenue earned from customers purchasing the company’s goods or services.
- Cost of Sales (also known as Cost of Goods Sold, or Cost of Revenue): This is the amount of money the company has spent in the production of its goods. It would include costs for raw materials, labor, and manufacturing/
- Gross Profit or Margin: This represents the profit a company has earned only after taking into account the Cost of Goods Sold (#3). The number is calculated by subtracting Cost of Goods Sold from Net Sales.
- Operating Expenses: This figure represents the costs that the company pays for running the business. If a cost is not directly related to producing the good or service, it is included here.
- Operating Income: This figure represents earnings from normal operations without taking in to consideration taxes and special one-time occurring items (e.g.: settlement of a court case). It is calculated by subtracting Operating Expenses from Gross Profit.
- Interest Expense: This figure reflects the cost of borrowing money.
- Pre-tax Income: This figure represents total earnings before being taxed.
- Income Taxes: This figure best represents what taxes the company expects to pay during the time period specified. It is usually an estimate since taxes are normally paid once a year but Income Statements are prepared four times a year.
- Special or Extraordinary Expenses: This figure represents special expenses the company had to pay during this period of time that were not part of the daily operations, such as purchasing a warehouse or a large piece of machinery
- Net Income: This figure represents the profit (or loss) the business earned after subtracting all expenses and taxes.
Main Points to Remember
- The Income Statement represents how well a company is doing financially during a period of time. It summarizes the revenue, expenses, and profit into one easy-to-read financial document.
- Investors pay close attention to an Income Statement because it is an accurate snapshot of a company’s performance over a specific period of time.
- Lenders evaluate the suitability of a loan based on the Income Statement because it shows the profit a company is making.
- Investors pay close attention to the “bottom line” and expect this figure to grow consistently over time. The “bottom line” figure is often the first data point an investor looks at when determining whether or not to invest.
- Comparing Income Statements from one period to the next is a great indication of the direction a company is heading. If Net Income is increasing, then the company is heading in the right direction. If it is decreasing, then the company needs to make some changes.
Finding Income Statements
You can find the income statements of every publicly traded company in the United States using the Research tool.
Just open the Research page, and click “Financial Statements” on the left side of the page. You can review the Balance Sheet, Income Statement, and Cash Flow Statement for every publicly-traded company in the United States, going back 5 years.
Pop Quiz!
[qsm quiz=20]