Flags and Pennants are categorized as a continuous pattern. They normally represent only brief pauses in a dynamic stock. They’re typically seen immediately after a quick move. The stock will then take off again in the same direction. Research shows that these patterns are many of the most reliable continuation patterns. Take a look at typical Flag and Pennant pattern.
Bullish flags are identified with lower tops and lower bottoms, and with the pattern slanting against the trend. However unlike wedges, their trend lines run parallel.
Bearish flags are made up of higher tops and higher bottoms. Bear flags will also have a inclination to slope against the trend. Their trend lines run parallel as well.
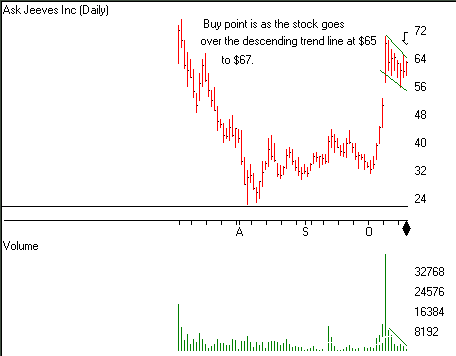
Pennants look a lot like a symmetrical triangle. However pennants are normally smaller in size (volatility) and duration. Volume in most cases contracts during the pause with an increase on the breakout.
HERE IS A SAMPLE CHART WITH A FLAG & PENNANT PATTERN
