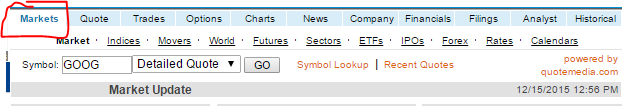
We have a huge amount of research tools available on our Quotes Page. On this page, you’ll find a second level of navigation to move between different research tools right at the top.
Basic Quotes And Beginner’s Research
If you’re just getting started, most of the information you’ll need will be in the main “detailed quotes” page.
Detailed Quotes
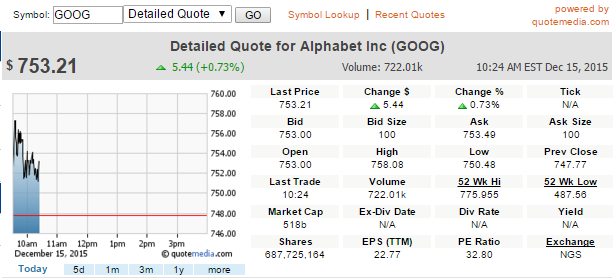
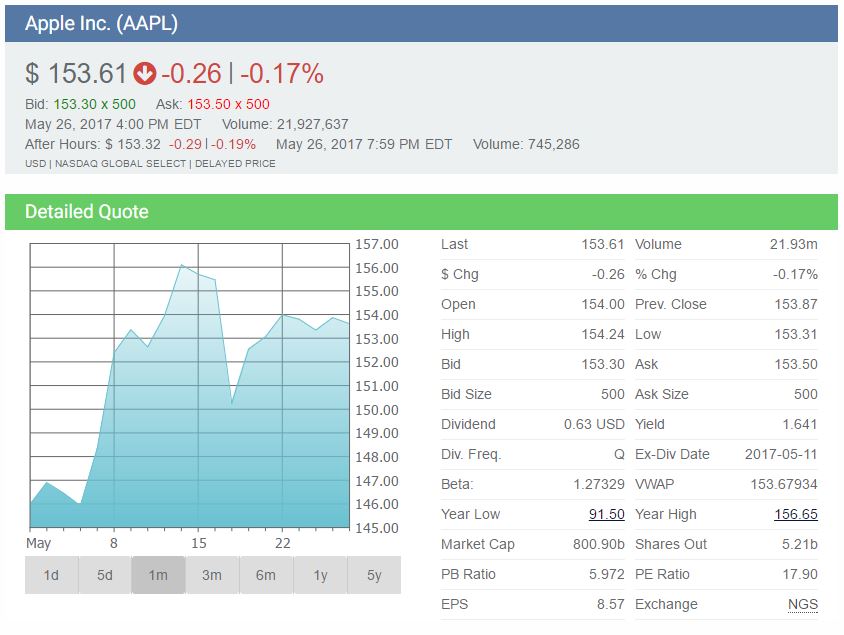
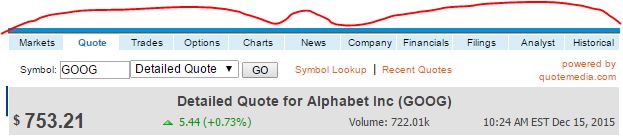
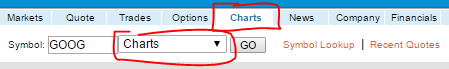
At the top you can enter your symbol, and click “Go” to pull up the detailed quote. On this page you will find:
- A chart showing this stock’s performance so far today. If it is the morning before markets open, the chart will be blank. If it is a day where the markets are closed, the chart will show the last trading day. There are also tabs to see different date ranges, but you can get more detailed charts on a different page.
- You can also find the “Last Price”, “Bid“, “Ask“, day’s change (both in dollar amounts and as a percentage), the trading day’s high and lows, and the previous trading day’s closing price
- You can also find the “Last Trade” timestamp. This is important for thinly-traded securities – a security needs to trade in the real world for it to trade in our system. If this timestamp doesn’t have today’s date, it means that this security hasn’t traded today, so your order will not immediately execute if you try to trade it
- The volume indicator is also important for trading – you can only trade as much of a security as has traded in the real world on a given day (could be more or less depending on your tournament rules, but there will always be volume restrictions)
- If this stock has an upcoming dividend, you can also see the date, rate, and amount
- You can also get some other basic information about the stock itself, such as the total number of outstanding shares, the Earnings Per Share, and the PE ratio (along with a notification of which exchange provided this quote)
News
You can also get news on each stock from this page, just below the Detailed Quote there will be a news feed with the most recent stories featuring this stock.
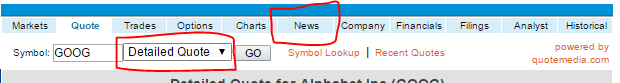
You can find the News as part of the detailed quotes page, or on its own by selecting “News” from the drop-down menu next to the symbol input, or as a tab on the research navigation
Charts
You can also see a variety of chart types. You can switch between different chart types, but below will always be a chart showing volume.
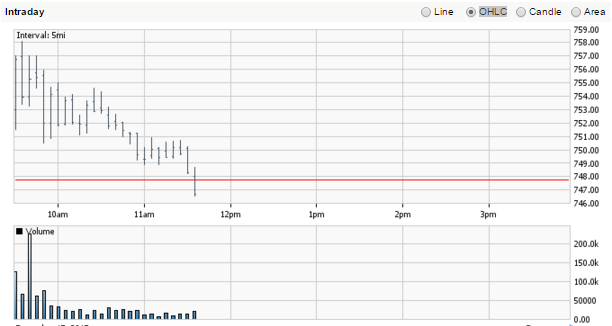
You can switch between the following chart types:
- Line
- OHLC
- Candle
- Area
There is also a switcher at the bottom that will let you toggle between time horizons, anything from intraday through 10 years. There are more tools in the Charts tool that we will cover in “Advanced Research”.
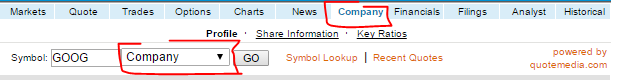
Company Information
You can find information on most companies as well, including a brief description of the company, their corporate address, CEO, and their classification used in the Pie Charts on the “Company” page
There are also some tools for fundamental analysis on this page, which we will cover in the “Advanced Research” section.
Historical Prices
You can also get the historical prices for stocks on the last tab in the main navigation:
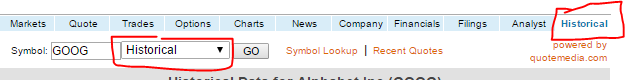
This will show the date, open, high, low, close, volume, change, change percentage, and adjusted close (adjusted for dividends and splits) of nearly every stock. We do not currently have the ability to export this information to Excel directly, but you can specify your date range and copy/paste to excel yourself.
Overall Market Information
On the main quotes navigation, the first tab is “Markets”. This will show overall market information which is not relevant on any particular symbol.
Overall Market Data
The “home page” for this will show hourly charts for the NASDAQ, S&P500, and a composite of the S&P500 and TSX indices.
Market News
You can also get a snapshot of overall market and specific sector news
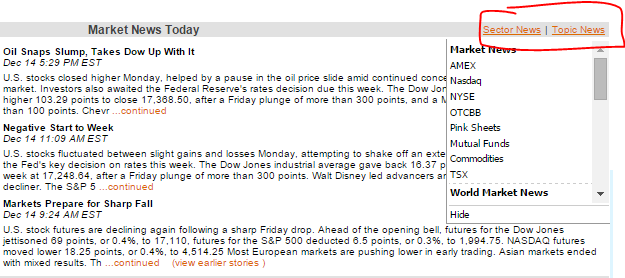
By clicking either of these items, you can filter down to a specific sector, or a specific “topic” (OTCBB stocks, or mutual funds, for example).
Below this news feed, you can also see the volume of some of the biggest stocks on a few exchanges, along with the current Forex rates (denominated in US Dollars).
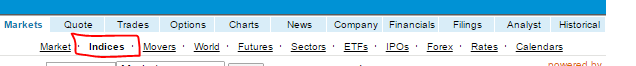
Indices
The “Indices” link will show you a snapshot of selected indices from the United States and Canada
Movers
The “Movers” tab will show the day’s biggest market movers, selected from stocks on the NYSE
World
The “World” selection is somewhat more limited, but does feature composites of several world markets, along with some daily performance charts
Sectors
The “Sectors” tab will show a list of all major sectors, along with many sub-sectors. By clicking on any, you can get a 5-day comparative chart showing the top several stock’s performance, along with some basic quote information of the biggest players in each sector.
ETFs
The ETFs selection will show the top 10 best and worst ETF performers from the last trading day (you can switch between US and Canadian ETFs).
The bottom features an ETF snapshot, where you can switch between any ETF family you are most interested in.
IPOs
The IPOs research section features a news section for new IPOs, along with news feeds for the US and Canada, which outlines both new listings, de-listings, re-listings, and suspensions. There is also a pie chart to illustrate the balance between the four categories.
Forex
The Forex tab will show the current exchange rates for any currency pair (over 50 currencies represented). There is a currency converter tool along with the current exchange rates in USD for all comparisions, along with a cross currency table for 8 major currencies.
Rates
The “Rates” tab outlines the major US interest rates, long with major US bond rates. You can also find GDP growth, mortgage interest rate data, and unemployment data on this page.
Analyst Ratings
You can also find expert analyst ratings for nearly every stock, including the rating of buy/sell, how many analysts are recommending each, and a brief illustration as to why the analysts are suggesting what they do under the “Analysts” tab.
Advanced Research
There are also numerous tools for more “in-depth” research”
Options
The “Options” tool on the main menu will show the option chain for most stocks.
Option Chains
By default, it will show a composite filter of calls and puts that are expiring soon and are “Near the money”, but you can also change these filters as you see fit.
Most Actives
You can also see which options for a particular stock are seeing the most volume for a day, both by LEAPS, Calls, and Puts.
Greeks
For more technical traders. you can also see the delta, gamma, rho, theta, vega, and IV for most options.
Advanced Charts
At the bottom of the Charts page, there are more buttons to see more advanced charts:
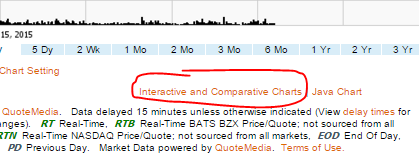
The advanced chart page supports many technical indicators, including adjustment for splits and dividends, just splits, or completely unadjusted. You can also plot each symbol against an index, or up to 10 other symbols.
You can also add more indicators, such as several different types of moving averages, Bollinger Bands, and many other indicators.
Advanced Company Info
On the “Company” tab, you can also find information on shares and several key ratios
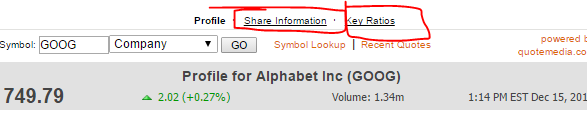
Share Information
The share information page will have a lot of information on the per-share statistics of this company, including:
- 52 week highs, lows, and change
- 21, 50, and 200 day moving averages
- Alpha, Beta, R-Squared, and Standard Deviation over 21 months
- Price changes over 7, 21, 30, 90, 180, and 200 days
- Month-, Quarter-, and Year- to date changes
- Average volume and shares outstanding
- Institutional holdings, along with the institutional buys and sells over the previous 3 months
- Some insider trading statistics
Key Ratios
You can also find some quick ratio information, such as Total Debt to Equity, Leverage, Margins, Return on Equity, and P/E ratios (among others).
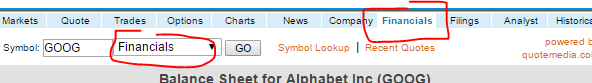
Financial Statements
For fundamental analysis, you can find the balance sheets, income statements, and cash flow statements (separated annually or quarterly) on the “Financials” tab
SEC Filings
For US equities, you can also find all the paperwork they have filed with the SEC, exportable to HTML, Microsoft Word, PDF, or (occassionally) Excel or Microsoft Access under the “Filings” tab.