![]()
 A wedge in the financial universe describes a triangular shape formed by the intersection of two trendlines, which form the apex. The wedge need not be upward facing and can easily be an inverted triangle. The “falling wedge” is often called a “flag” since it more resembles a pointed flag more than a typical triangle.
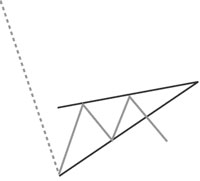
A Bearish Wedge, or Flag, consists of two converging trend lines. The trend lines are slanted upward. Unlike the Triangles where the apex is pointed to the right, the apex of this pattern is slanted upwards at an angle. This is because prices edge steadily higher in a converging pattern i.e. there are higher highs and higher lows. A bearish signal occurs when prices break below the lower trendline.
A Bullish Wedge or Flag consists of two converging trend lines. The trend lines are slanted downward. Unlike the Triangles where the apex is pointed to the right, the apex of this pattern is slanted downwards at an angle. This is because prices edge steadily lower in a converging pattern i.e. there are lower highs and lower lows. A bullish signal occurs when prices break above the upper trendline.
 Since the data creating the design is typically slanted against the current trend, a descending flag is considered a “bullish” indicator, while a wedge is viewed as a “bearish” predictor. A typical wedge or flag lasts longer than one month but less than three months. Longer trends will often create designs other than a wedge or a flag.
Take a look at this chart that contained a Bullish Flag formation that preceded a strong rally:

Pennants are popular with Day Traders because this chart pattern rarely shows up in longer time frames. If you like to trade shorter term, you should be looking at charts closely for pennants and you may start seeing them in your dreams at night because they are so reliable and common.