
Operating ratios are a class of ratios that are meant to analyze how well a company is using their assets. Specifically, these ratios show how well a company utilizes its assets to create revenue. Like many of the ratios that are used in financial analysis, operating ratios are complex ratios. Some use simple measures in their numerators and denominators, such as COGS (Cost of Goods Sold) and revenue, but many incorporate other ratios into the calculation. Therefore, it is crucial to have a firm grasp on the most basic ratios, such as working capital. Like all ratios, these are only meaningful when compared across time, and to the industry norm.
Sample Financial Statements
We will use the following sample financial statements as the example for all of our ratios.
Exhibit 1 – Income Statement
Income Statement Year Ended 20X5
| Revenue | $100,000 |
| COGS | 40,000 |
| Gross Profit | 60,000 |
Exhibit 2 – Balance Sheet
Balance Sheet 20X5
| Accounts Receivable | $50,000 |
| Inventory | 10,000 |
| Current Assets | 60,000 |
| Land | 25,000 |
| Total Assets | 85,000 |
| Accounts Payable | 25,000 |
| Total Liabilities | 25,000 |
Common Operating Ratios
Inventory Turnover
The inventory turnover looks at how long a firm has inventory. The formula is:
![]()
For this firm, the inventory turnover would be 4x. This means that the firm completely sells its inventory about 4 times during the period. Some industries, like grocery stores, have a very high turnover, while others, like a Bentley dealership, will have very low turnover ratios. Therefore, it is crucial to understand what industry is being looked at, and what the average for that industry is. Comparing the ratios over time to see how it changes will also reveal any trends.
Days of Inventory on Hand (DOH)
Inventory turnover can be taken one step further to see how many times a firm depletes its inventory over the year. The equation is:
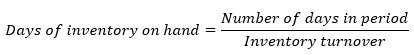
In most cases, the number of days will be 365. In this case, 365/4 is ~91. This means that every 91 days, inventory is completely depleted. A high turnover ratio, and thus a low DOH ratio, may mean that the firm isn’t keeping enough inventory on hand. A low turnover ratio, and a high DOH ratio, may mean the firm is having issues selling the inventory. These ratios often point toward other problems in the firm, and are used as a starting place. If turnover is low, one may want to look into the company further to find out why.
Receivables Turnover
The receivables turnover ratio shows how many times in a given period cash is collected from buyers. The formula is:
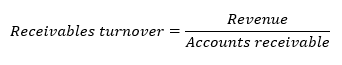
This firm has a receivables turnover of 2x, which means that is collects from its customers twice in a period. A number that is this low may indicate that the company’s credit policies are too relaxed, or that the firm lacks credit efficiency. On the other end of the spectrum, a high turnover can mean that the company has either a very efficient credit policy, or is very strict with its policy and may be losing customers to competitors with more relaxed policies.
Days of Sales Outstanding (DOS)
As with DOH, days of sales outstanding allows an analyst to determine how many days a year sales are outstanding for a given firm. The ratio is calculated as:
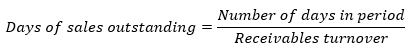
The DOS for this firm is 182.5 days, which means the company goes 182.5 days without collecting from its customers. Again, it is important to compare to the industry average, because certain ratios that may seem abnormal are actually quite normal for a given industry.
Payables Turnover
The payables turnover ratio describes how quickly a firm pays its vendors. It can be calculated as:
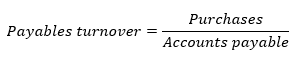
If purchases is not readily available, it can be determined as COGS + ending inventory – beginning inventory. For the purposes of this example, purchases will be $75,000. Therefore, the payables turnover for the firm will be 3x. If the turnover ratio is higher than the industry average, it could signal that the firm is paying too quickly, or taking advantage of a credit discount. In contrast, a low ratio could indicate that the firm is having trouble making payments on time, or that the firm is taking advantage of lenient credit terms.
Number of Days Payable
The number of days payable is used to determine how many days in a given period a firm waits until paying its outstanding balance. It is calculated as:
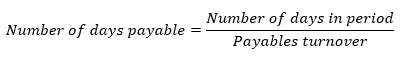
In this example, the firm has a number of days payable of ~122. Therefore, every 122 days the firm pays off its balance. Coupled with the days of sales outstanding, this measure can be used to calculate the cash conversion cycle. The cash conversion cycle shows how quickly a firm converts its investment in inventory into cash. While that measure is typically used for liquidity purposes, it is useful to see how various ratios can be used in different ways.
Total Asset Turnover
The final operating ratio is the total asset turnover, which shows how efficiently a company is able to convert its assets into revenue. Total asset turnover is calculated as:
![]()
The total asset turnover for the firm is 1.17. In other words, this means that for every $1 in assets, the firm is able to generate $1.17 in revenue. A higher ratio indicates that a firm is efficient at converting assets to revenue. However, since both current and long-term assets are included in the measure, it can be difficult to interpret. This lesson is part of the PersonalFinanceLab curriculum library. Schools with a PersonalFinanceLab.com site license can get this lesson, plus our full library of 300 others, along with our budgeting game, stock game, and automatically-graded assessments for their classroom - complete with LMS integration and rostering support!

Get PersonalFinanceLab
[qsm quiz=136]