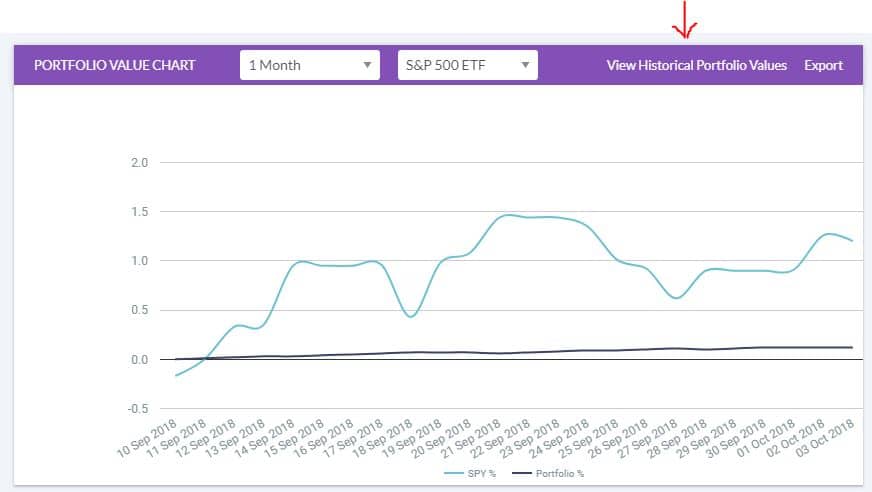
If you’ve been trading for a long period of time you might have been curious to know what your daily returns were. Excel and Google Sheets can help you efficiently calculate this in a simple way. Suppose we started trading on August 29th, 2017. It is now September 7th and we would like to know our daily returns for our portfolio. First, we would look up our Historical portfolio values by going to our Dashboard, and clicking “View Historical Portfolio Values” next to our Portfolio Value Chart:
Once there, simply click on Historical Portfolio Values and a new window will pop up displaying the data. The page should look something like this:
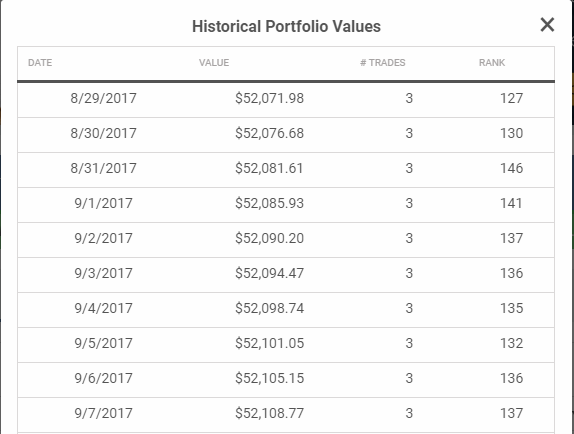
You can either click the “Export” button to download this as a spreadsheet, or copy the data into your spreadsheet.
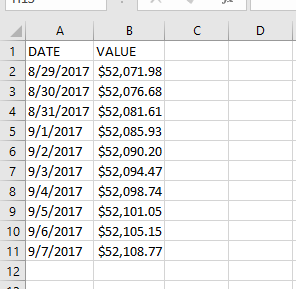
As mentioned in our Getting Some Data article, values may sometimes appear as “#####”. To fix this, you simply need to adjust the column widths.
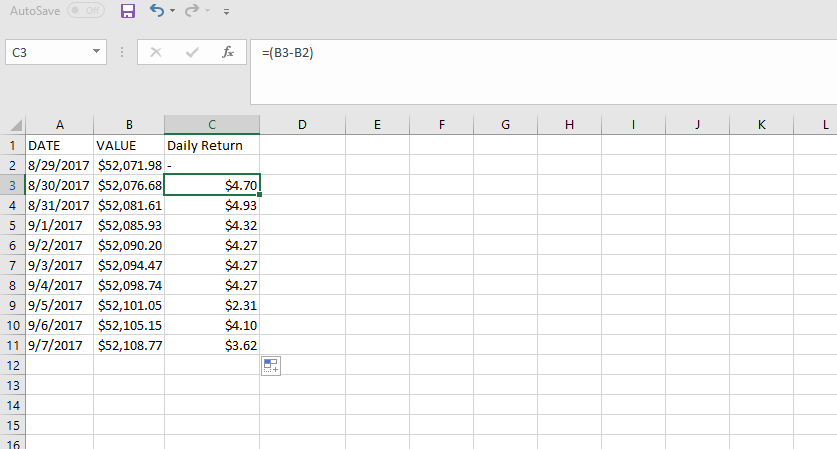
Next, we add a heading for Daily Returns under column “C”. We can then create a function on Excel or Google Sheets to calculate each days’ return for us in dollars. Since we only started trading on August 29th, we wouldn’t have any returns for that day and we can leave that cell blank. Instead, we would write the function onto the second cell under the column, cell C3, and drag it downwards from the bottom right of the cell to copy it onto the rest of the column. The function we would input is “=(B3-B2)”. It should look something like this on your Google spreadsheet or Excel:
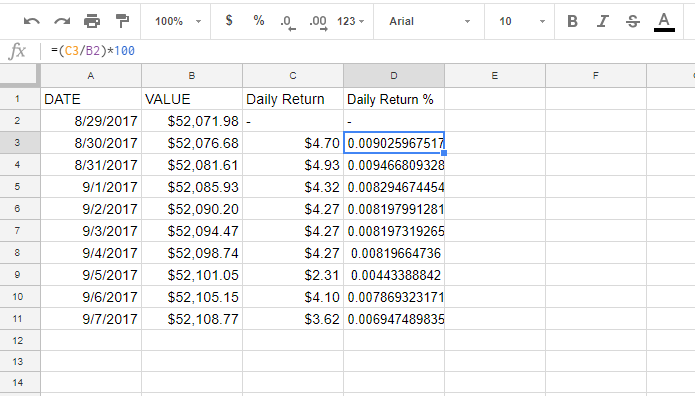
The values we have calculated here are our daily returns in dollar amounts. If we wish, we can also find these amounts as a percentage. To do this, we would create another heading on column D and name it “Daily Returns %”. Then, we would click on the second cell under this column (Cell D3) and input the function “=(C3/B2) *100”. This should give us a value of 0.009%. To repeat this for the other dates, simply drag the 0.009% value downwards the same way we did for the dollar value. Google Sheets/Excel will then calculate the remaining values for us. We have now calculated our daily returns in a dollar amount and as a percentage. The final spreadsheet should look something like this:
This lesson is part of the PersonalFinanceLab curriculum library. Schools with a PersonalFinanceLab.com site license can get this lesson, plus our full library of 300 others, along with our budgeting game, stock game, and automatically-graded assessments for their classroom - complete with LMS integration and rostering support!
Get PersonalFinanceLab
[qsm quiz=195]